Sinking Funds Savings Chart, 1 Year Bi-Weekly - Printable
Sinking Funds Savings Chart, 1 Year Bi-Weekly - Printable
Couldn't load pickup availability
- File(s) will be available for download immediately after purchase.
- Digital file(s): No physical goods will be sent.
Share
DESCRIPTION:
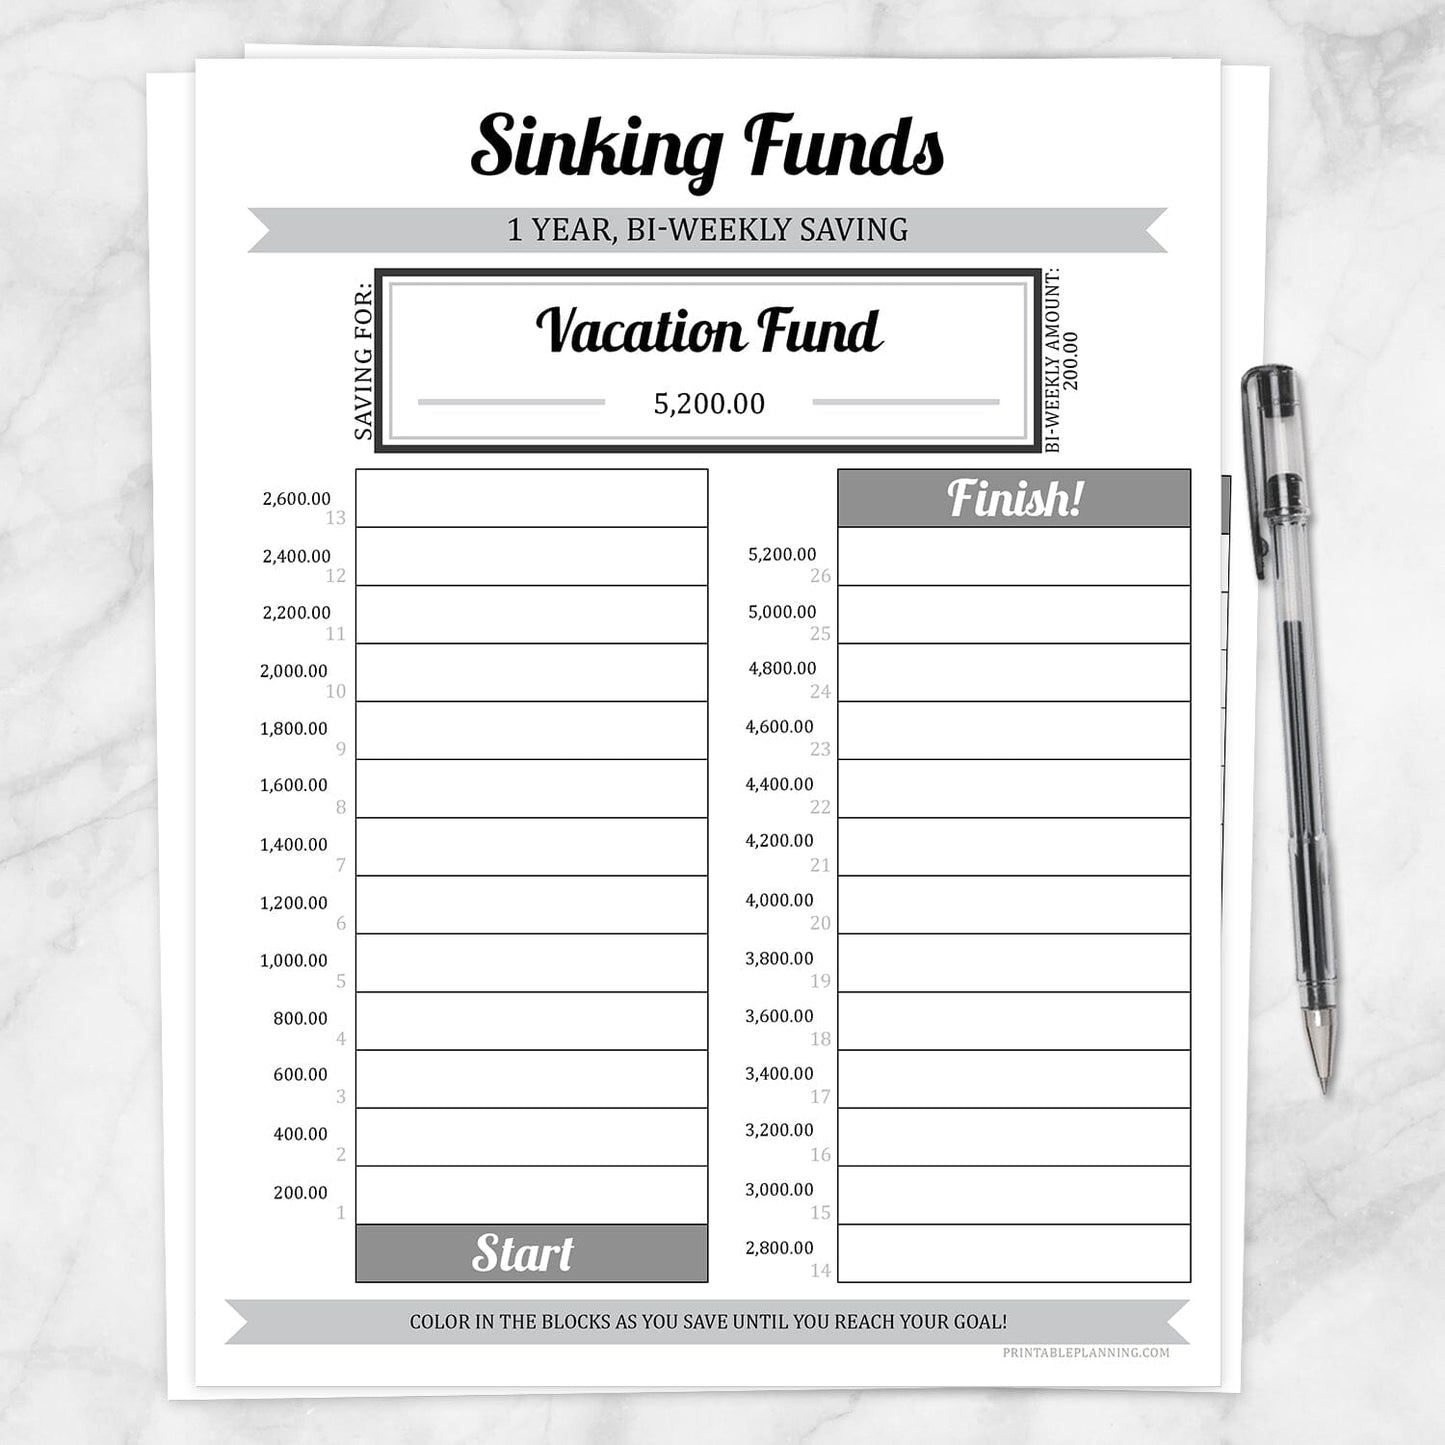
A printable Sinking Funds Savings Chart, 1 Year Bi-Weekly with auto-calculating totals to help you save up for anything you want or need. This sinking funds chart is for when you have a goal or item to save money over 1 year when you have bi-weekly pay periods or plan to put money aside every 2 weeks.
⭐ How it works:
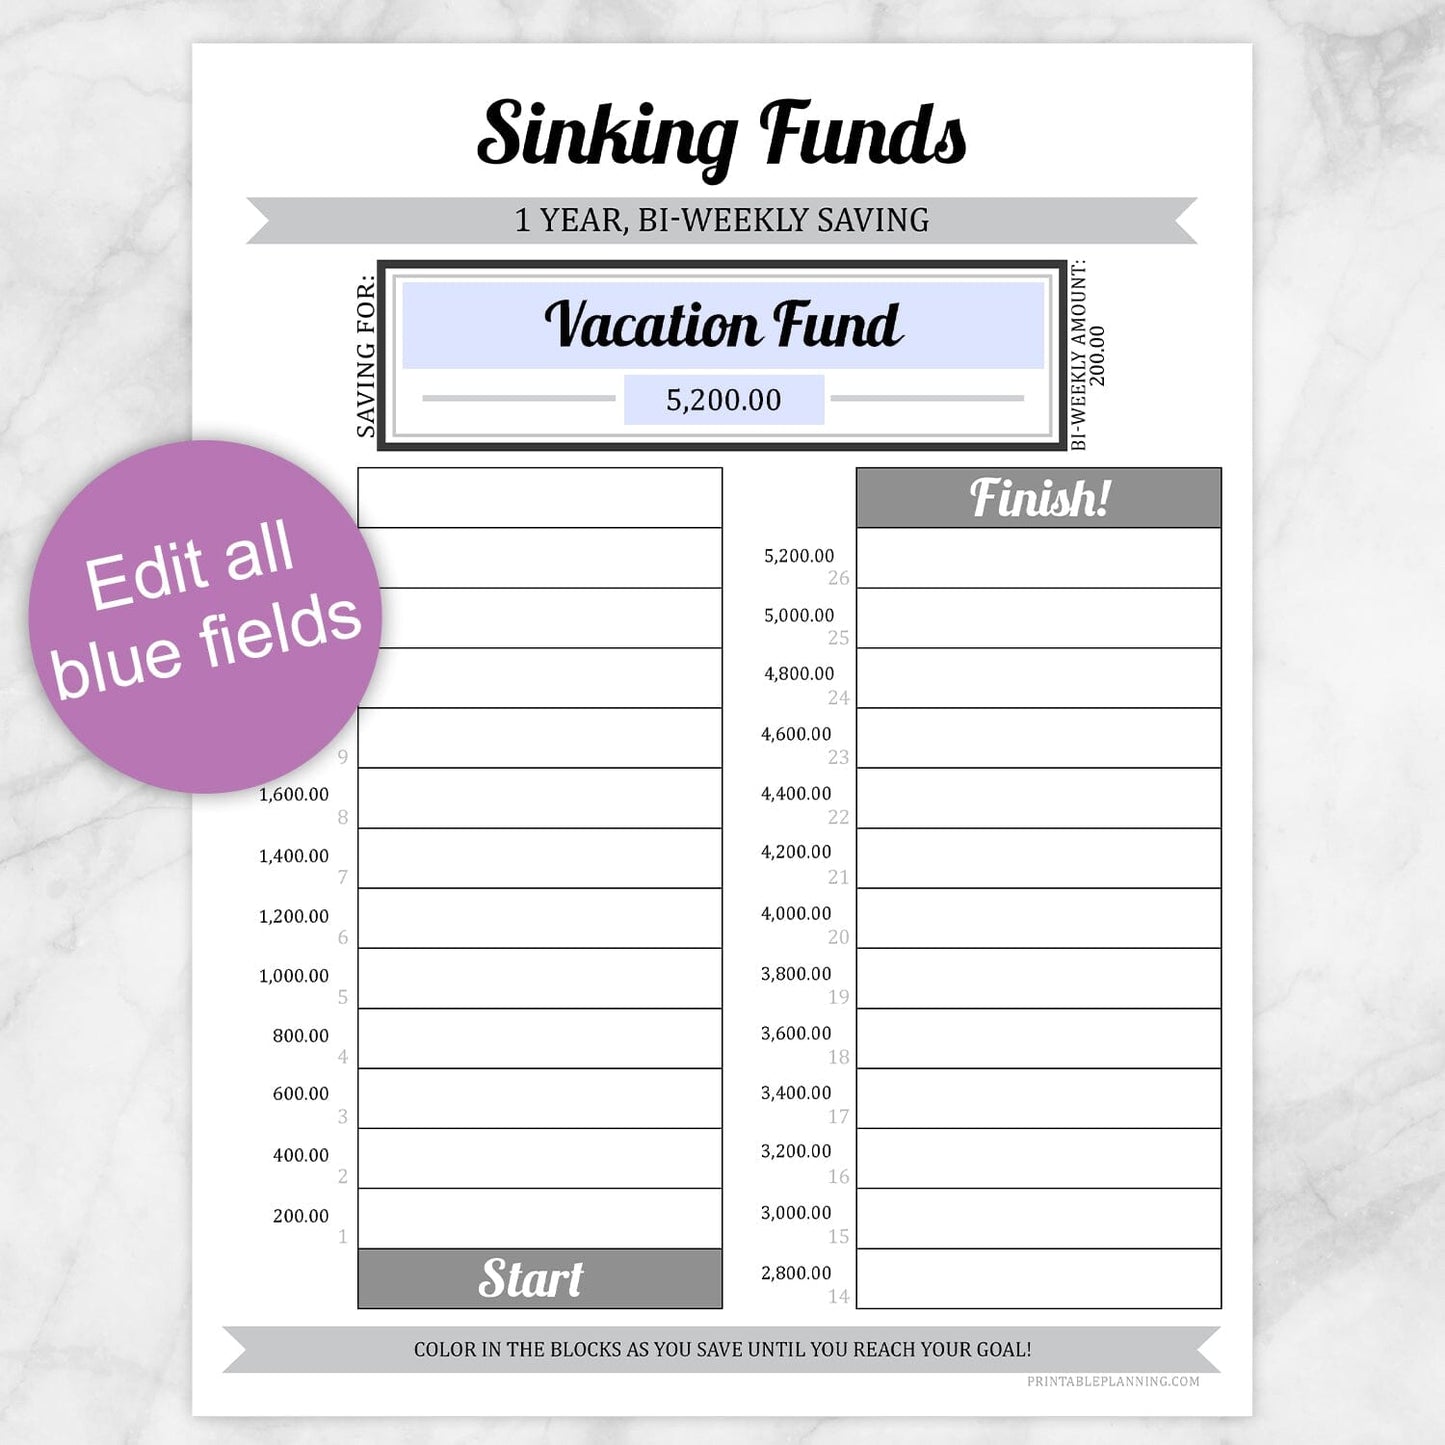
- Personalize this worksheet with the name of the thing or goal for which you're saving.
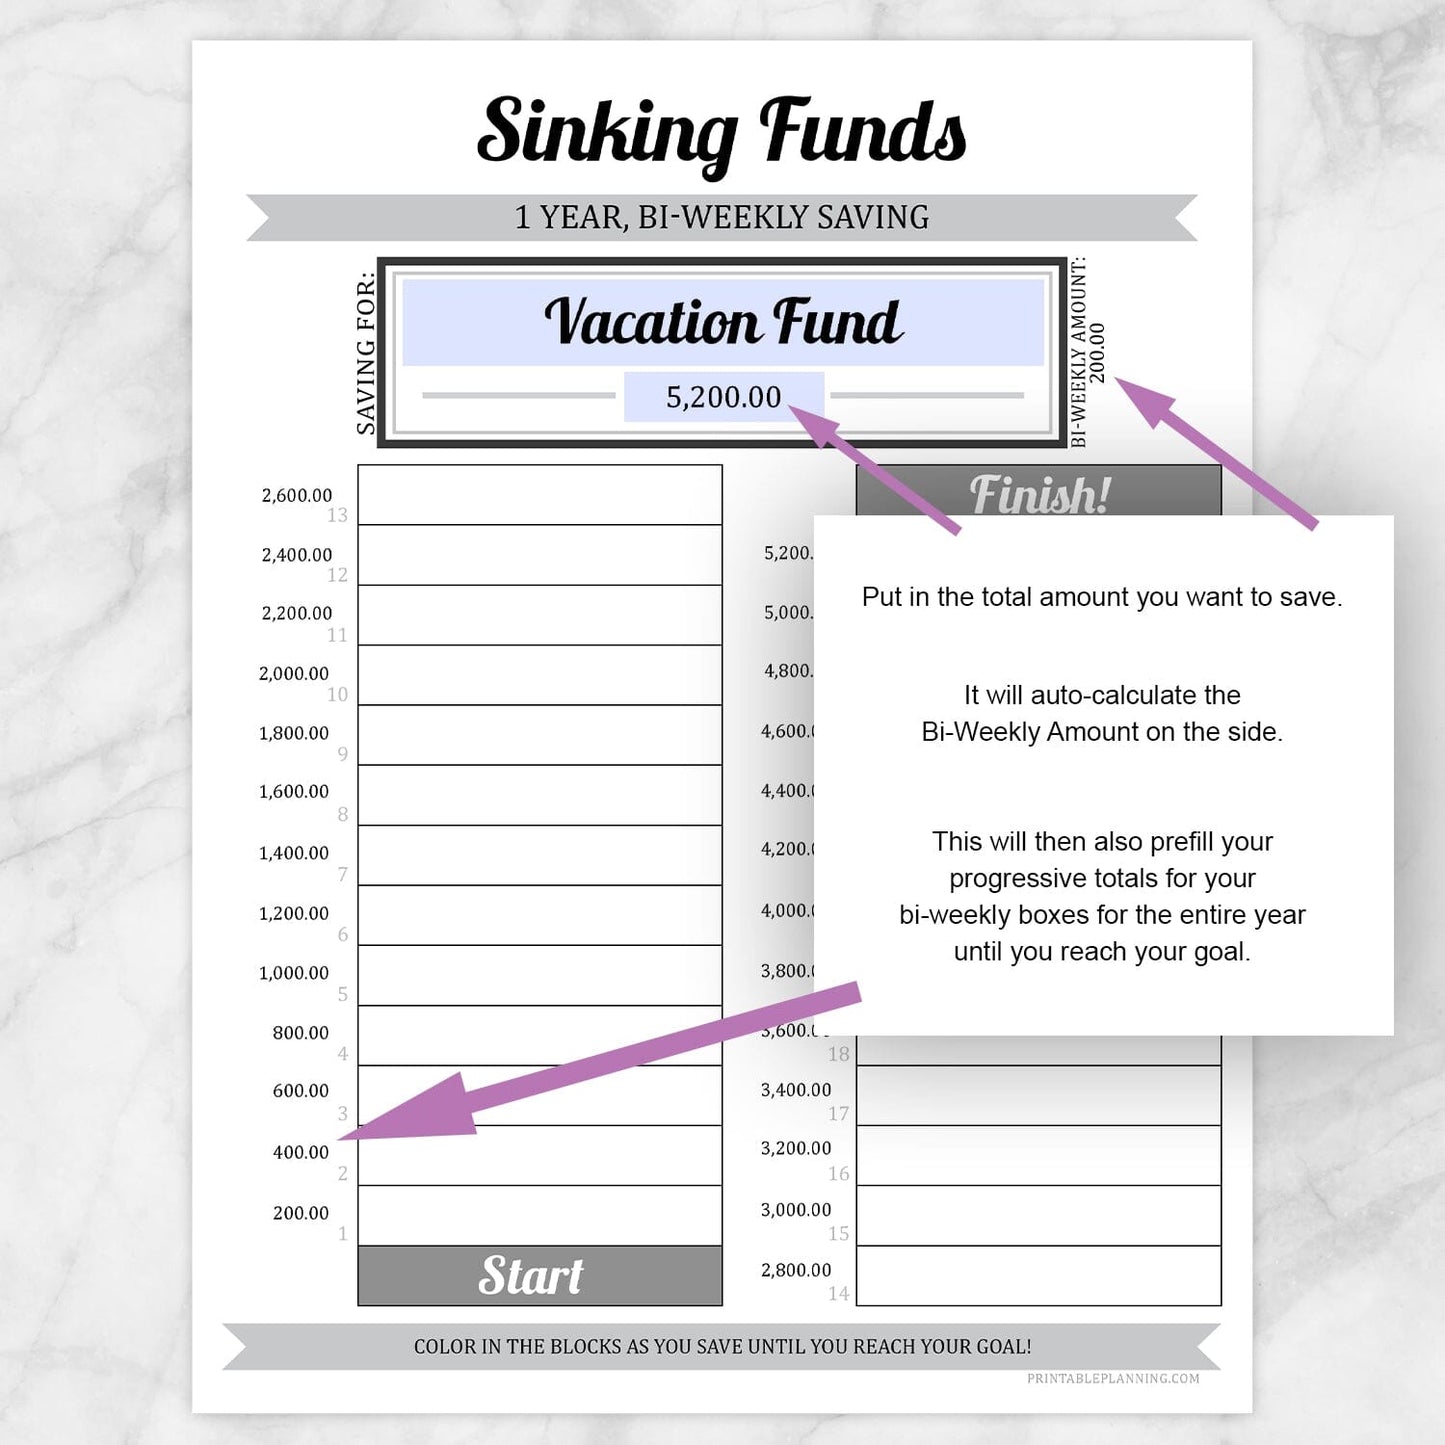
- Enter the total amount you need to save.
- This sheet will then auto-calculate the bi-weekly amount you'll need to save every 2 weeks.
- It will also pre-fill your progressive totals next to your bi-weekly boxes, keeping track of the total amount that will be saved as you go.
- As you save your money every 2 weeks, use a marker or crayon or whatever else you want to use to fill in the boxes for that period in the progress bar as you go so you can see your savings progress!
⭐ NOTE: This is only for:
- 1 Year time period.
- Bi-weekly savings.
SPECIFICATIONS:
- 8.5" x 11" printable PDF page. (Use PDF Reader to make the applicable edits).
- 1 Year.
- Bi-Weekly savings.
- Personalize the item/goal for which you're saving.
- Chart auto-calculates all sub-totals when you edit your total amount.
- The lack of a currency symbol makes this chart work for most currencies.
- Easily keep track of your progress while saving.
- Print a new printable Sinking Funds Savings Chart, 1 Year Bi-Weekly with auto-calculating totals whenever needed.
Terms of Use & License Info
Terms of Use & License Info
Thank you for choosing Printable Planning! I truly hope you enjoy and get great value from the printables offered here. Below are the Terms of Use that apply to any files purchased from Printable Planning.
Please read carefully before purchasing or using your files.
Terms of Use
- Each purchase includes a single-user license. Your files are for personal use only by the individual who purchased them. Sharing, distributing, or gifting your files to others is not permitted.
- These printables may be used within your own small business or workspace to help you stay organized. However, you may not share the files with other team members or staff. If multiple people need to use the files, please purchase additional copies accordingly.
- If you would like to share a product with a friend, colleague, or audience (such as in a blog post or on social media), please link directly to the product listing on Printable Planning. Do not share the file itself or upload it to any platform.
Prohibited Uses
- You may not sell, redistribute, copy, alter, or share the digital files or printed materials derived from them.
- Files may not be edited, modified, or used to create derivative works for resale or distribution.
- Commercial resale or redistribution in any form is strictly prohibited. These products are for personal use only.
- Uploading files or designs to any file-sharing site, marketplace, or AI software for training, distribution, or resale is not allowed.
Can I share with my household or coworkers?
- You may print files for your personal use or within your own household.
- For teams or businesses: each individual using the files must purchase their own copy. Please purchase one per user.
Violation of these terms may result in loss of access to future purchases and/or legal action. We work hard to provide affordable printables and rely on your honesty and integrity to keep this small business going. Thank you for supporting a small, independently run shop!
Terms are subject to change at any time without prior notice.


